(Who does that remind you of on the right?)
When the depths of humanity have ranted at my pro-FSG propaganda campaign, waged from within The Tomkins Times’ infamous dungeon, plotting away purely to wind Twitter trolls up by forcing world class managers not to sign centre-backs; by forcing club employees to seek greener grass; by causing panic attacks at the heart of the defence; then coming up with an article praising the Reds’ attacking performance – after drawing at Anfield, against Burnley, after throwing points away in the Champions League, days after throwing boots at opposition goalkeepers – is quite clearly insidious propaganda from Edward Bernays’ School of Population Manipulation. Here goes …
But first, read this by Beez on Liverpool’s chance quality – like a perfectly-timed Coutinho throughball – for some fantastic context, detail and insight; it also outlines how the number of players between the shooter and goal influence the conversion rate of shots.
This data is incredibly important, as it can help with coaching. When is the optimum time to shoot? Well, the data from the 2016/17 Premier League suggests you want no more than two players between you and the goal. Splitting the data into buckets of 0-2 and 3-11 defenders makes for the closest even split available; there were 3,762 chances for the former, and 4,325 for the latter.
The difference in conversion rate is stark though. Twenty percent of shots were scored when faced with 0-2 opposition players, but only 6.4% when there are three-or-more.
Here’s one example from the game at Anfield against Dyche’s side, involving Trent Alexander-Arnold, who was on his left foot. Look at the amount of players between him and goal below and keep in mind when judging the rest of the chances we create.
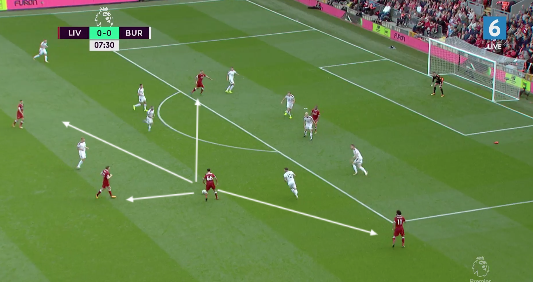
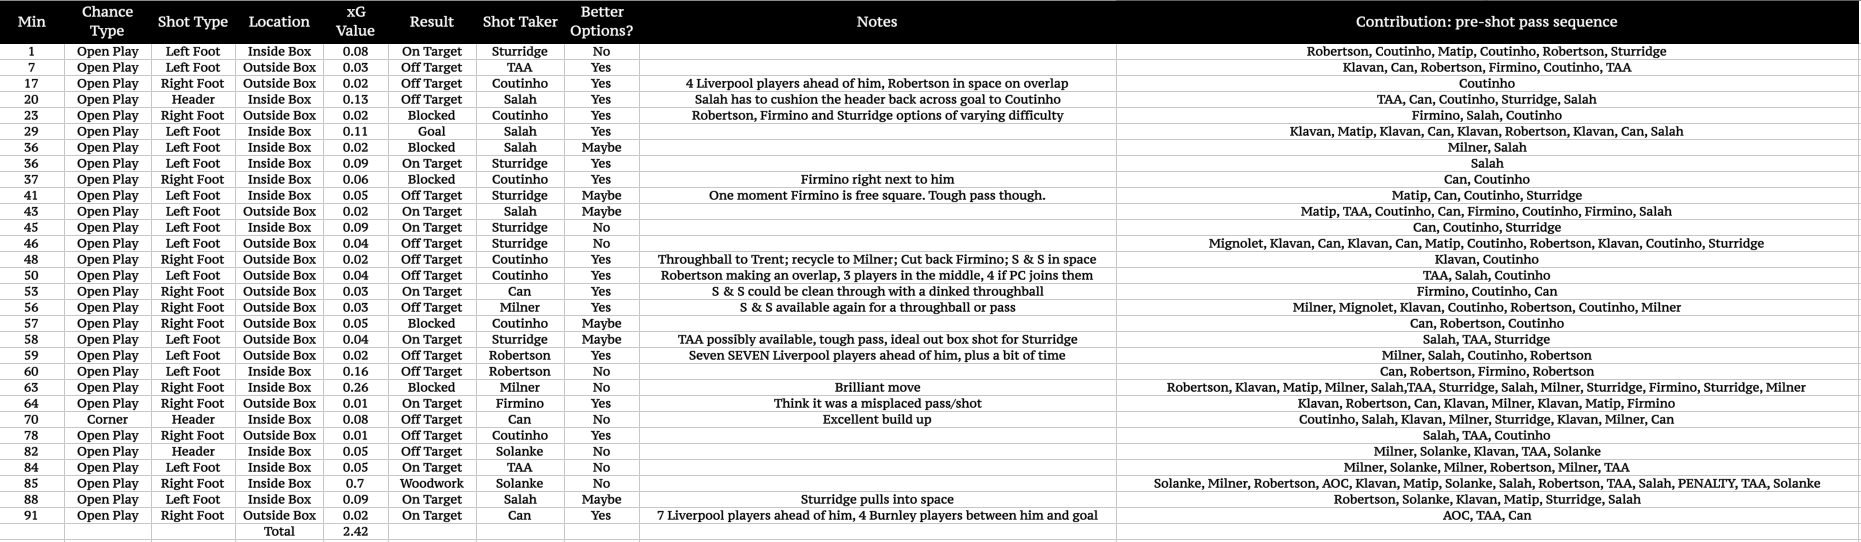
The process for this article involved watching the chances we created against Burnley (those available on Wyscout), looking in detail at the passing sequence preceding the shot; the possible options available at the time of the shot; the xG value of each chance, and the outcome of each attempt. Below is the table with all this data, and notes on potentially different options available to the shooter.
Chances Available on Wyscout:
(Click to view detail)
- 15 of the above attempts involve at least five passes or more, including individual defenders.
- Involvement ranges throughout the team, in a variety of chances, including:
-
- Direct passes
- One-two interplay around the box complimented by overlapping full-backs
- Crosses – short, long, whipped and floated
- Cutbacks
- Dribble and shot
- Slow, slow build up, pinged pass, flick, shot
- Possession worked on one side, switched, knock down, diagonal pass, headed attempt
Here’s a look at a section from the table above (for those too lazy to click!), it looks at the xG value of each shot, and asks if there were any ‘better’ options available at the time of the shot. This isn’t the first time we’ve done this on The Tomkins Times, in fact, this article was interactive and asked subscribers to vote on each shot.
Shot Table:

First caveat: using the term ‘better’ is tough to quantify accurately.
Second caveat: football is fast paced game, and a player on the ball might not have the same view we get on the video replay. Some passes suggested may not even be possible, or the player might not have the ability to play the pass. For this reason, I was harsh, and pretty much outlined all the ‘viable’ options for fairness across the board.
Third caveat: for the video clips, I only used the more obvious examples of ‘better’ options being available.
The rest of this article is for subscribers only.
[ttt-subscribe-article]